
Reporting isn't just about collecting data. It's about clarity, flexibility, and speed. This month's Revlitix release is packed with updates designed to help you move faster with more control and less manual effort.
Whether you're switching between CRMs, juggling multiple report views, or creating weekly decks, this release was built for you.
Here's what's new and what’s improved.
What’s New
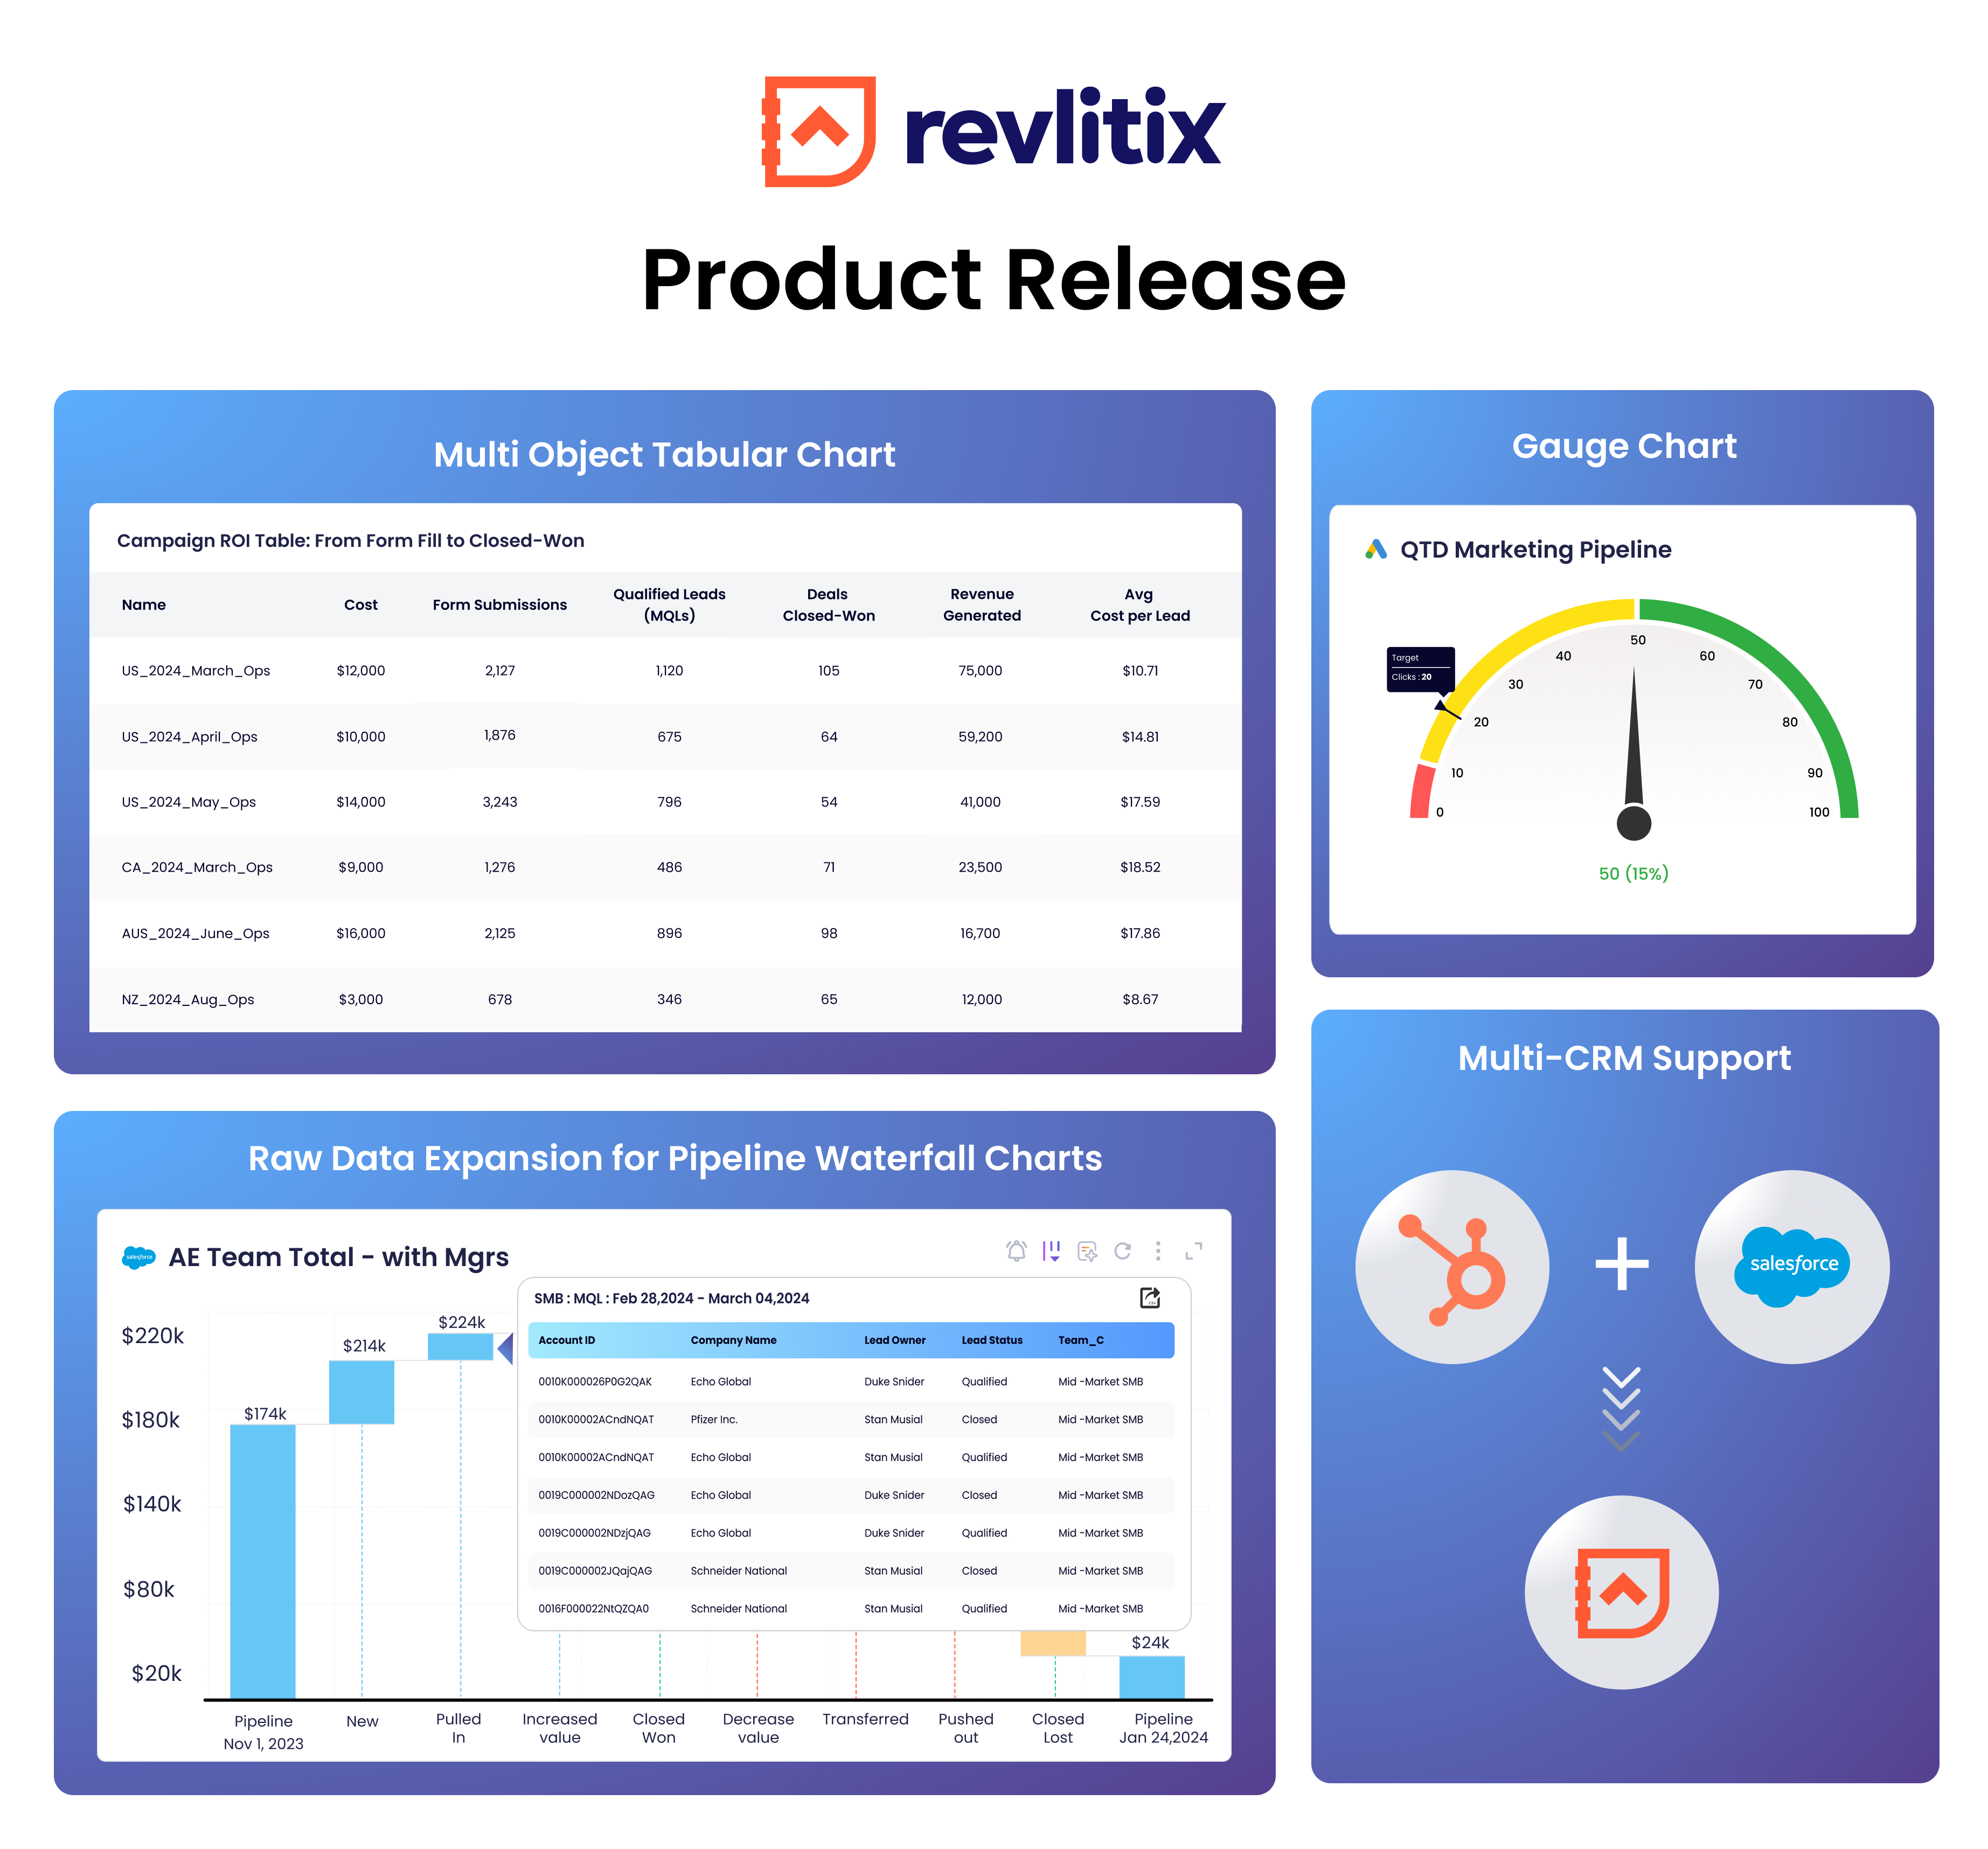
Gauge Chart
Track progress toward goals with an at-a-glance visual.
Why it matters:
Gauge charts provide a quick, intuitive view of how close you are to your targets. Whether it's revenue, pipeline, or lead conversion, these visuals simplify complex metrics and are ideal for leadership views or weekly reviews.
Use Case:
A CRO needs to track revenue progress across three business units. With Gauge Charts, they can show each unit's performance against quota in a single dashboard. This helps the leadership team focus instantly on what needs attention.
.png)
What’s Improved
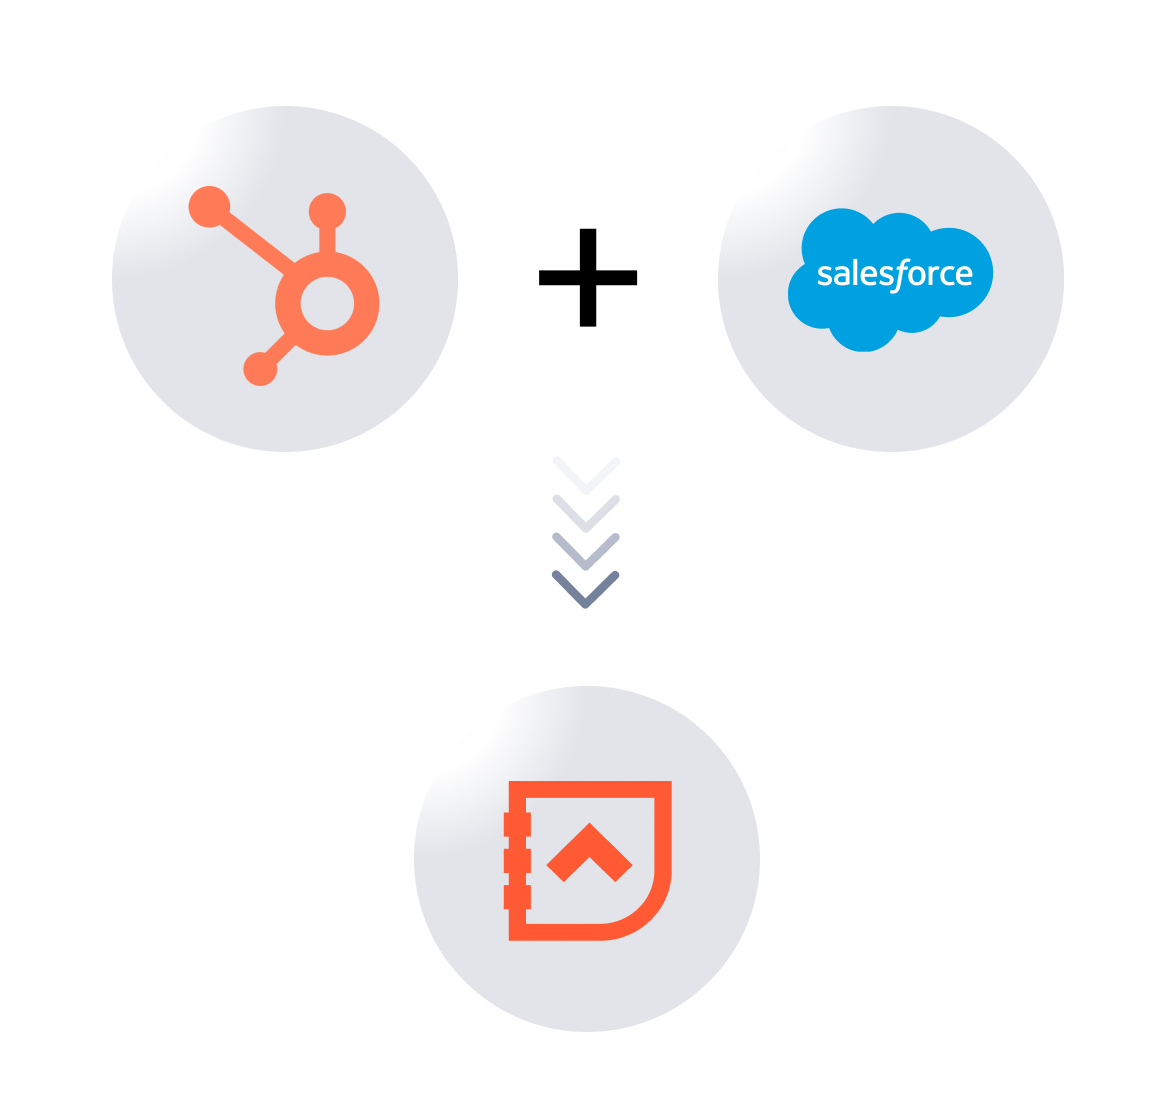
Enabling Multiple CRMs – Salesforce and HubSpot
Connect both Salesforce and HubSpot to Revlitix simultaneously.
Why it matters:
Many companies operate across different CRMs. For example, sales might use Salesforce while marketing relies on HubSpot. Now, you no longer have to choose. You can view and analyze both sets of data in one report.
Use Case:
A RevOps leader needs to monitor MQLs from HubSpot and opportunity status from Salesforce. Instead of toggling between platforms or stitching spreadsheets, they can now bring it all into one report in Revlitix.
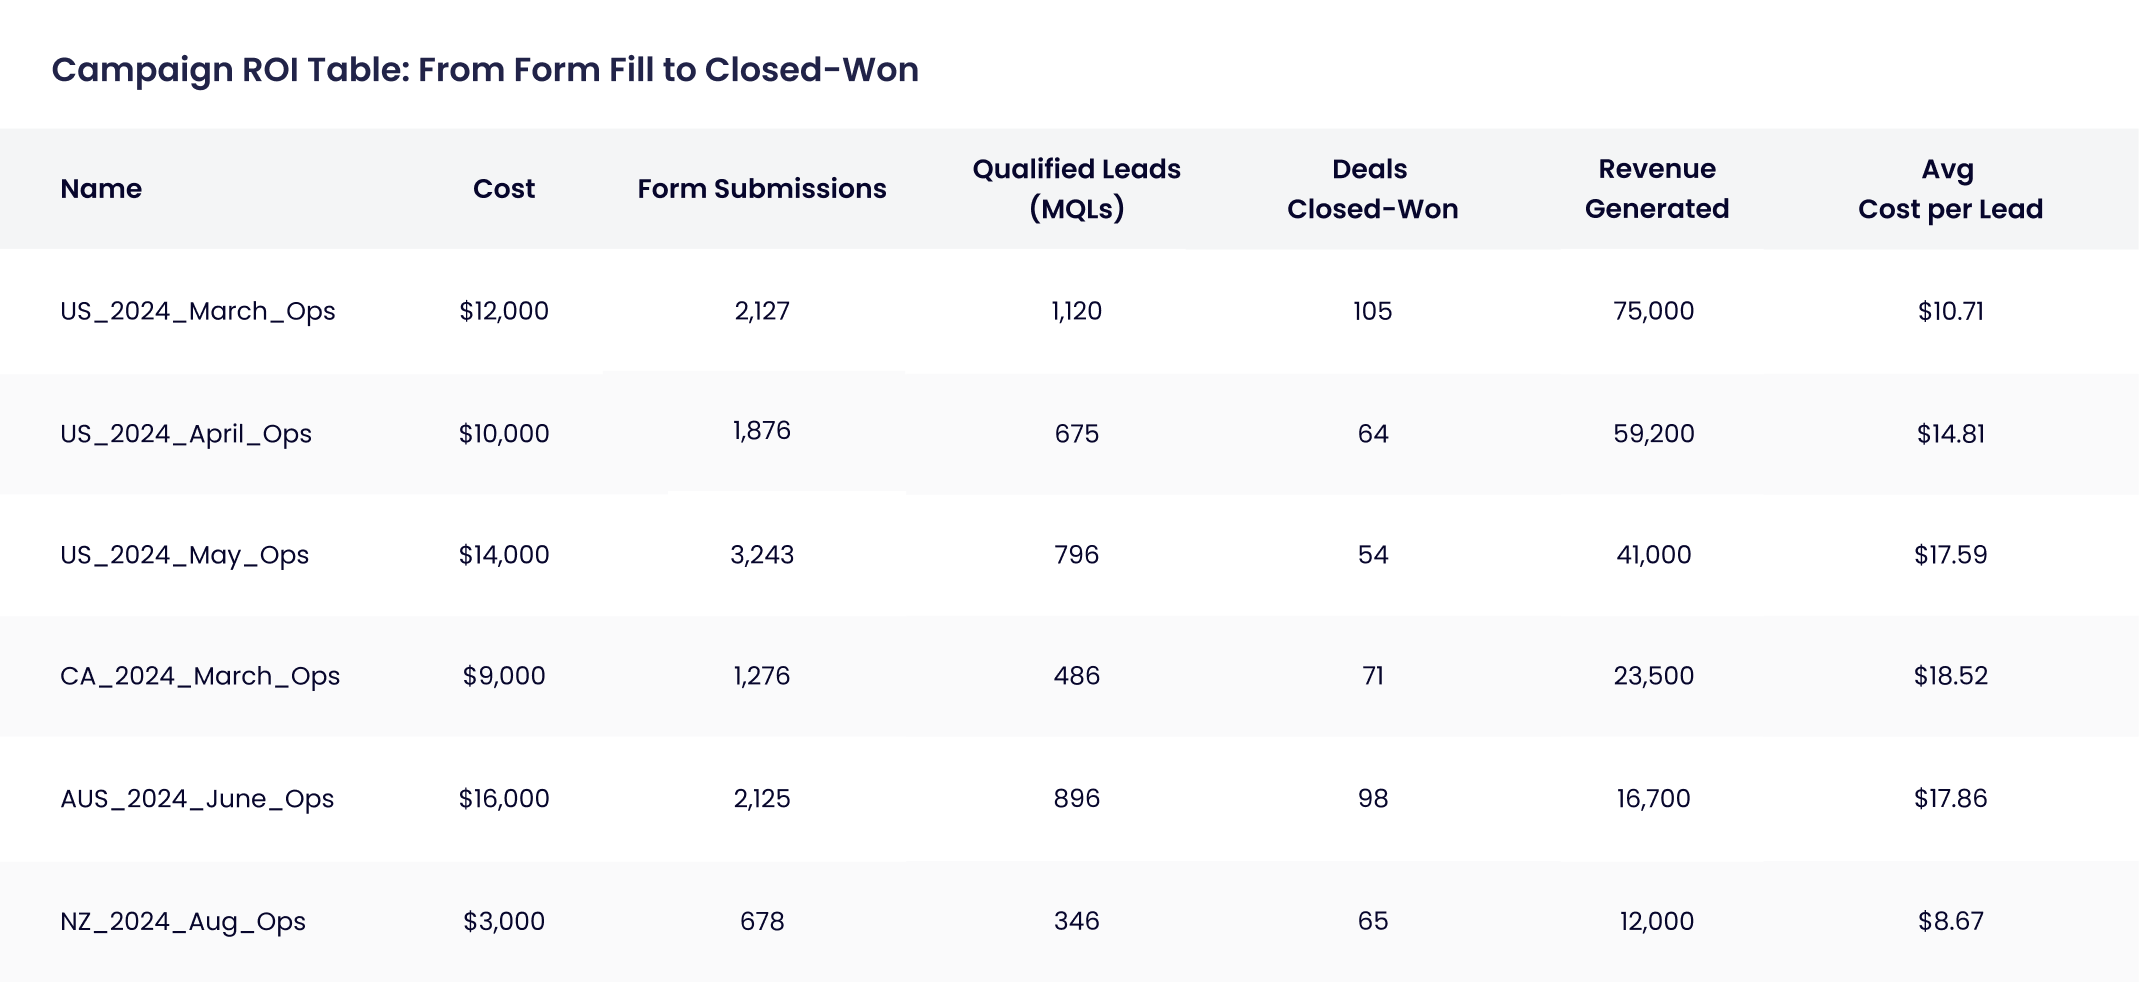
Multi-Object Support in Tabular Charts
Add and compare data across multiple objects in a single table.
Why it matters:
Tabular reports are great for granular analysis, but switching between objects like Leads, Opportunities, and Activities used to require multiple reports. Now, you can bring all of them into a single view.
Use Case:
A marketing ops analyst wants to measure ROI from campaign to revenue. With multi-object tabular support, they build a single table combining campaign cost (from Ad Spend), form submissions (from Web Activity), MQLs (from CRM), and revenue (from Closed-Won Deals). This allows them to assess performance across the funnel and calculate metrics like cost per lead and revenue per campaign in one connected view.
Raw Data Expansion for Waterfall Charts
View the detailed data behind each stage of your Waterfall chart.
Why it matters:
Waterfall charts show movement across stages, but sometimes you need to dig deeper. This feature allows you to access the raw records contributing to each step in the flow.
Use Case:
A RevOps manager sees a pipeline drop and expands the raw data to find most stalled deals came from Marketing-sourced leads in the Negotiation stage. This helps them act quickly and prioritize follow-ups.
.png)
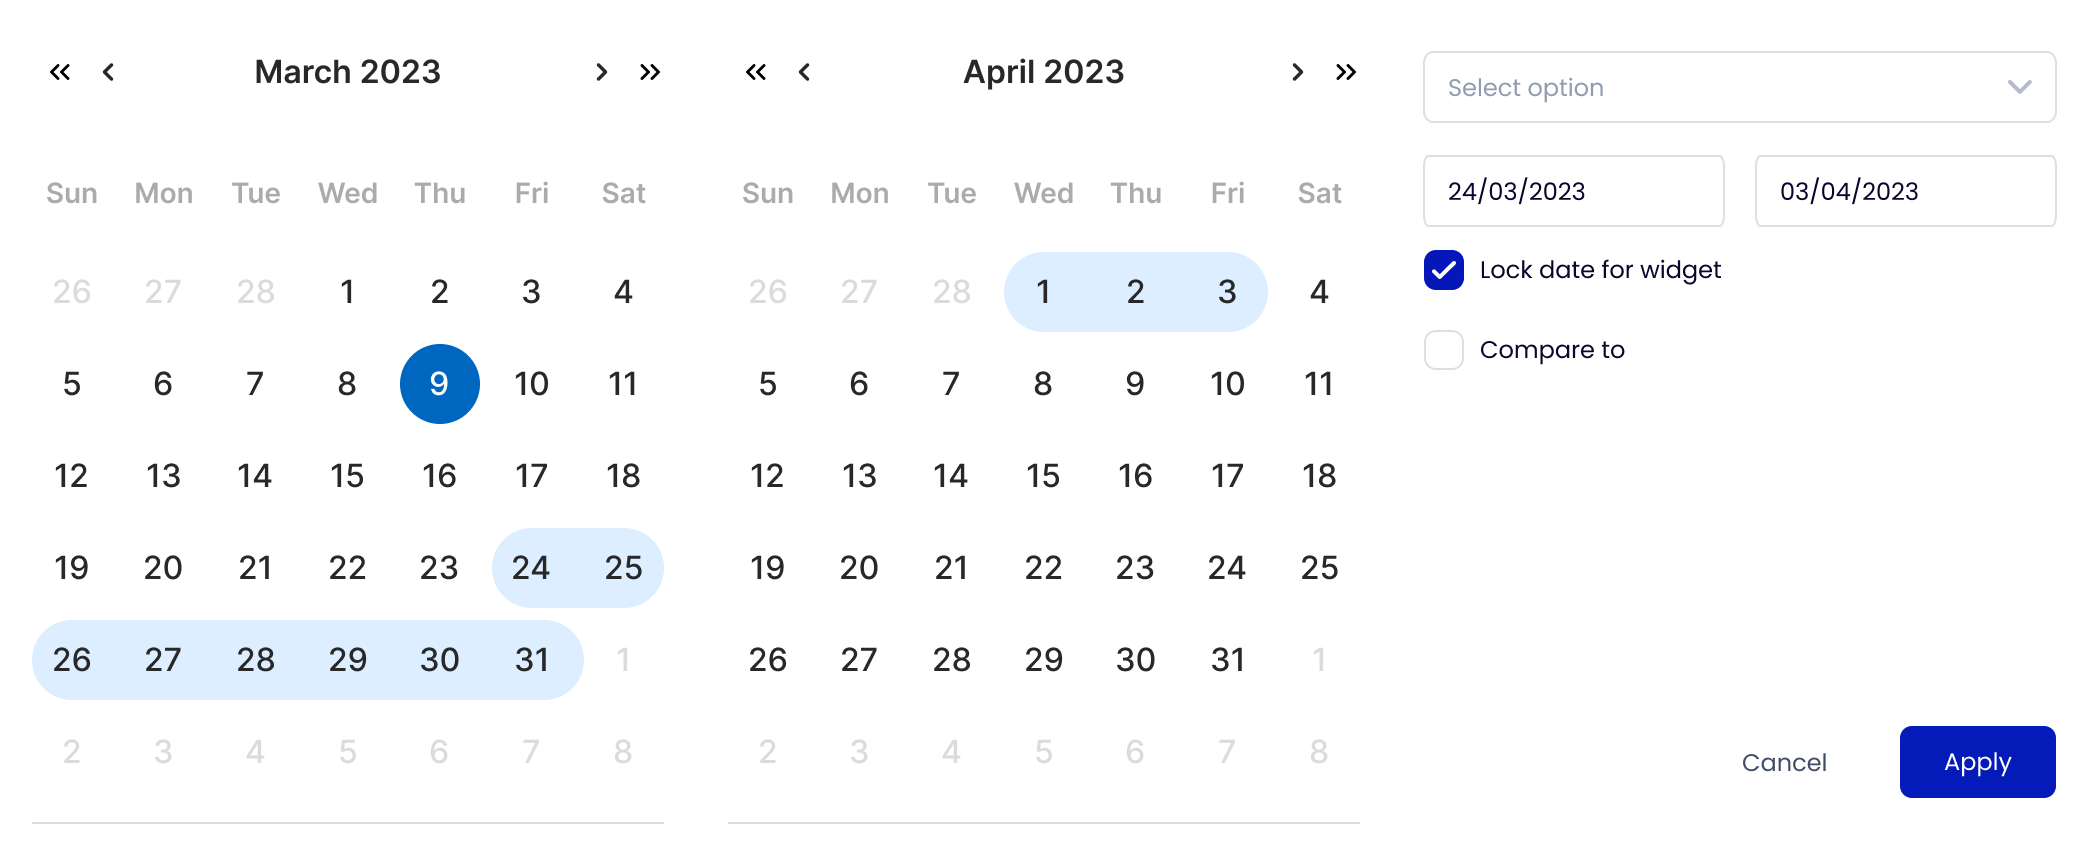
Widget Date Locking
Lock specific date ranges for individual widgets.
Why it matters:
In many reports, you might want one widget to show last 30 days while another shows quarter to date. Now, you can lock different date ranges per widget instead of changing the filter for the entire dashboard.
Use Case:
A demand generation leader wants to compare current month performance against last quarter. They configure one widget to always show "This Month" and another to show "Last Quarter," keeping both views fixed without adjusting filters each time.
Average of Stages in Funnel Charts
Display average values across all funnel stages for better visibility.
Why it matters:
Average stage values provide clarity on conversion health, deal size, or time spent in stage. Instead of calculating externally, you now get these insights directly in the chart.
Use Case:
A marketing ops team wants to track how long leads stay in each funnel stage. With this feature, they can see that leads are spending more time in the "Sales Qualified" stage than expected, indicating a potential bottleneck.
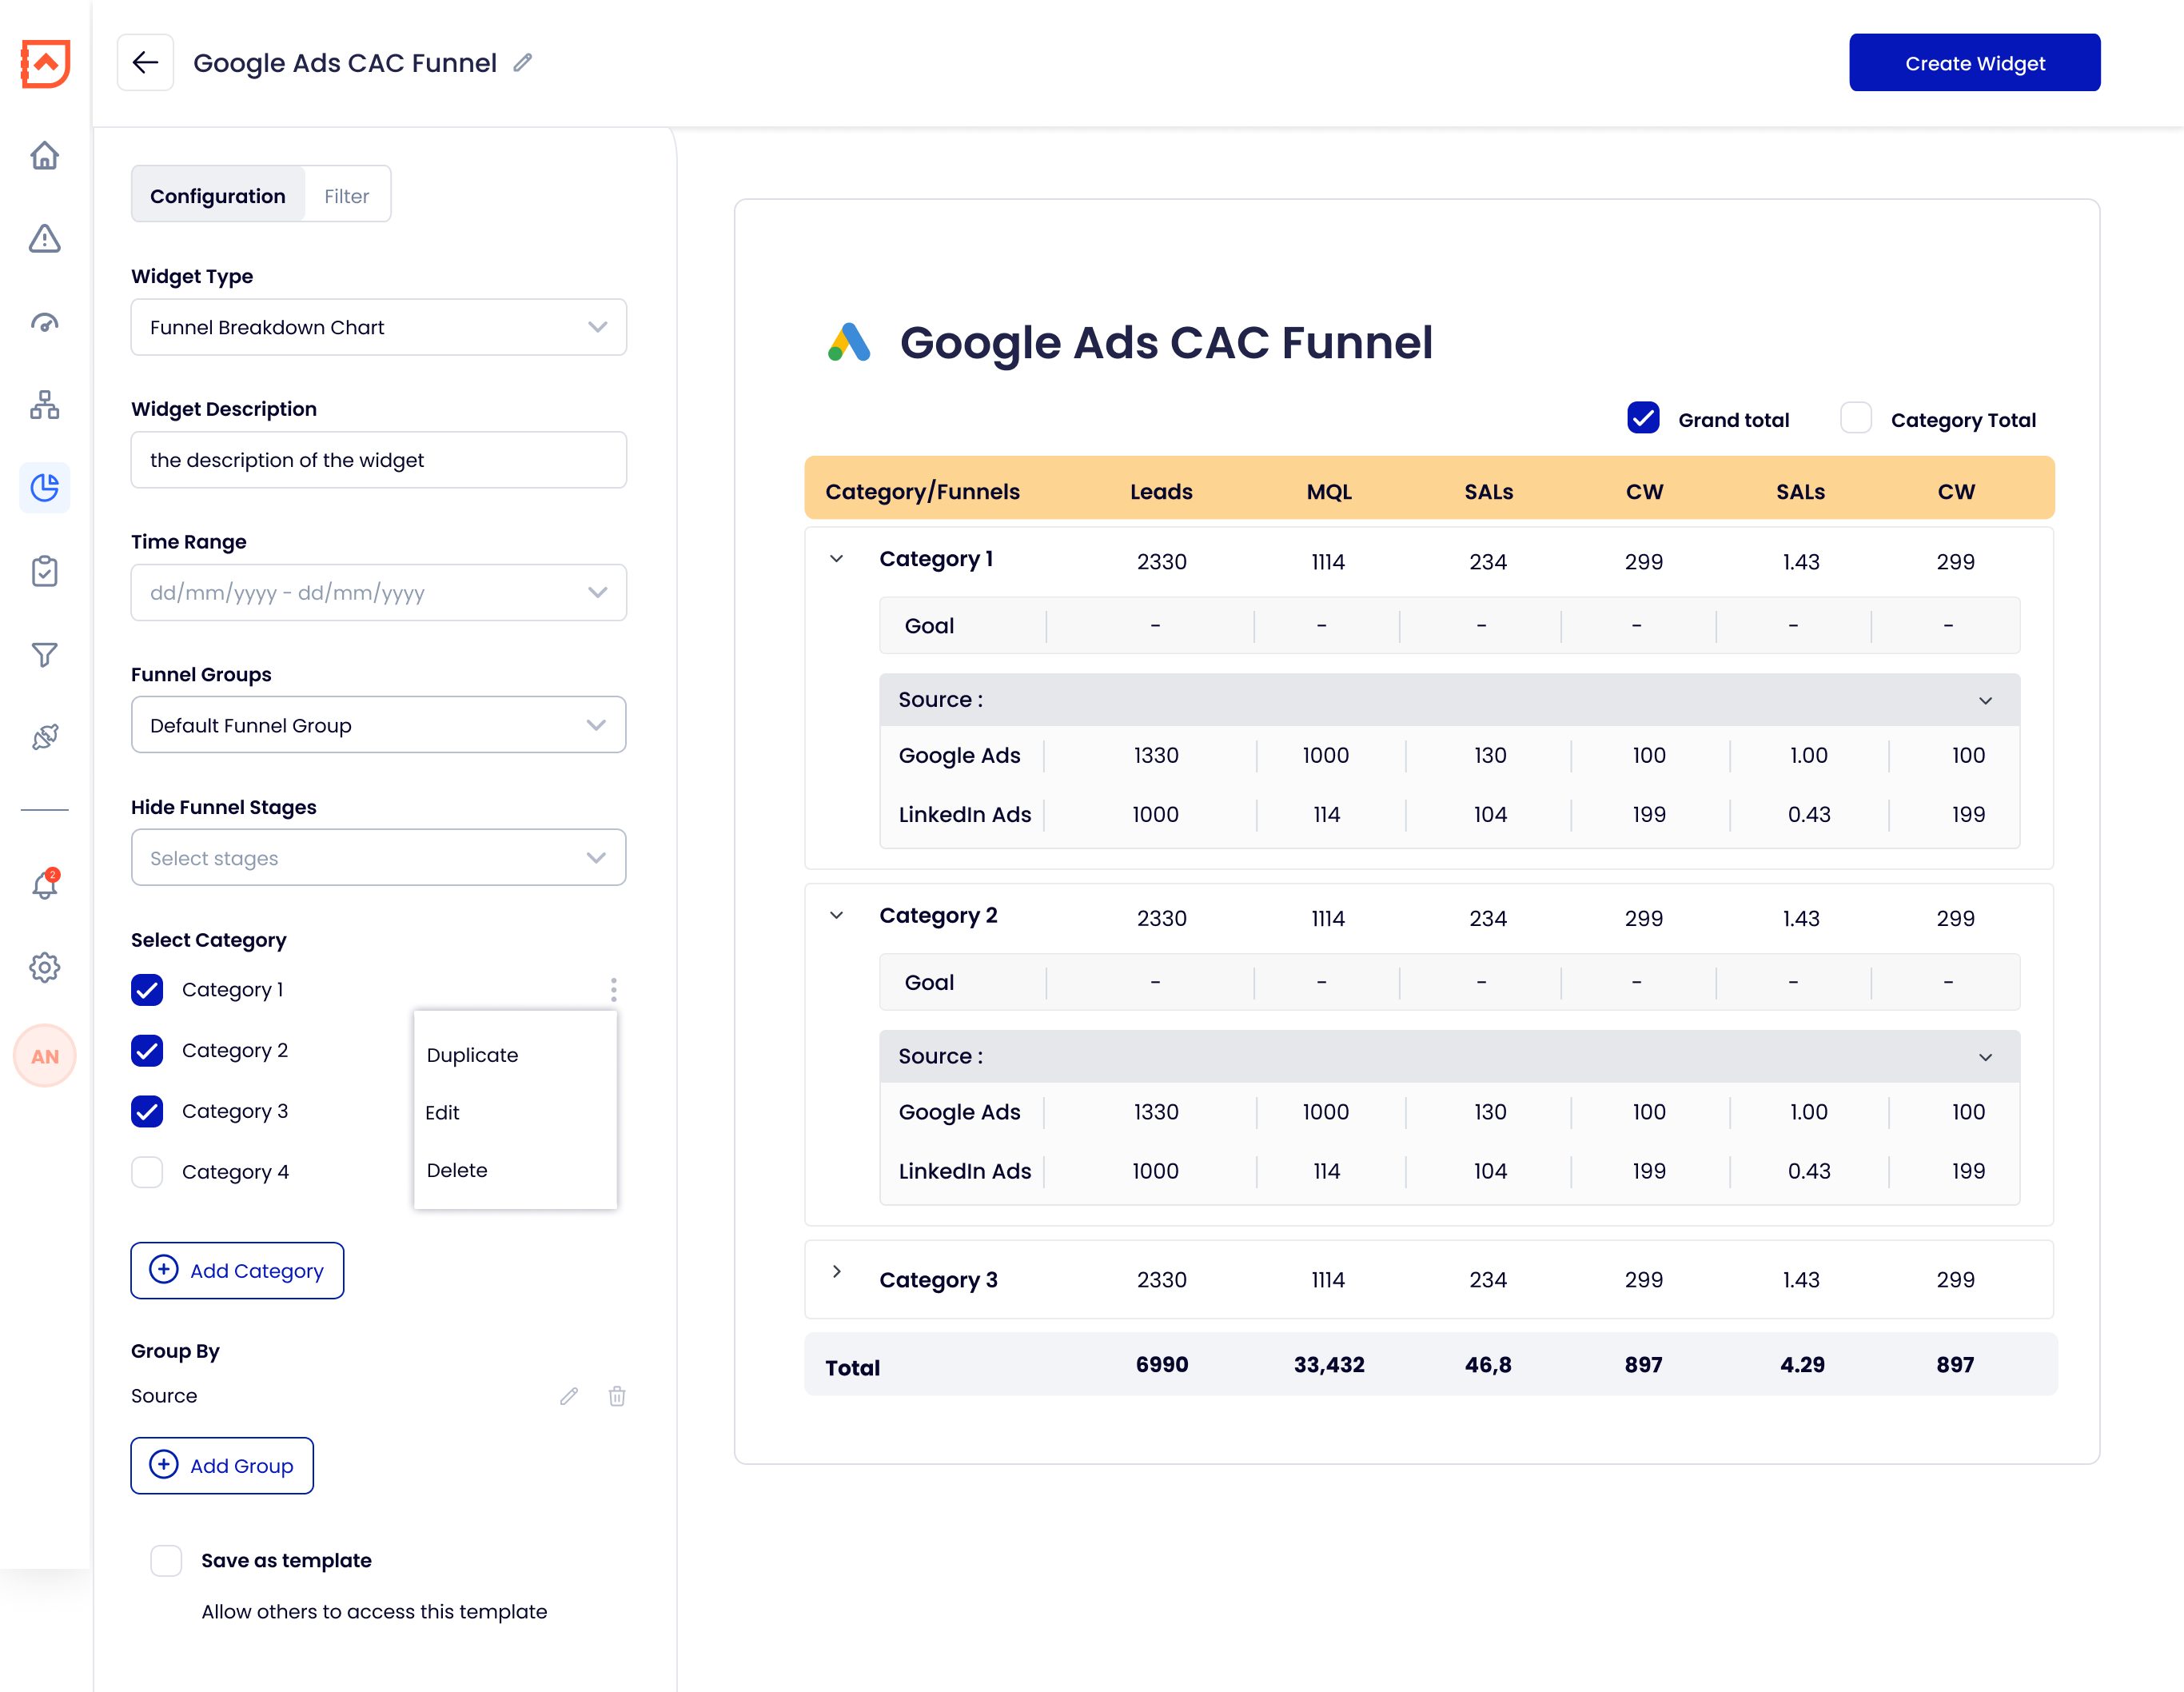
Hide Unwanted Stages in Funnel Charts
Remove irrelevant or inactive stages from your funnel visualizations.
Why it matters:
Not all funnel stages are relevant for every report or meeting. This update helps you simplify visuals by hiding stages that aren’t needed, making charts cleaner and more focused.
Use Case:
A VP of Sales doesn't want to display "Proposal Sent" during board reviews. Now, the RevOps team can hide that stage from the funnel and keep the presentation focused on key conversion steps.
Final Thoughts
This release is focused on what matters most—control, clarity, and customization. From multi-CRM connections to smarter chart displays, these updates help GTM teams build reports that answer real questions, and drive action faster.
Explore these features inside Revlitix today or reach out if you’d like a walkthrough tailored to your team’s setup.


